UK last mile delivery in the UK: a data-led guide for fleet operators & finance decision-makers
“Last mile delivery” is the final leg of a supply chain: moving goods from a local distribution point to the end destination, typically a home, workplace, retail unit, or alternative collection point. In the UK, it sits at the intersection of e‑commerce, parcel networks, and urban road space, which makes it commercially vital and operationally constrained at the same time. [1]
The sector is large and measurable through the parcels market. UK parcel volumes rose to 4,214 million items in 2024–25 (up from 3,936 million in 2023–24), while total parcel revenues were £13,185 million (in 2024–25 prices). Domestic parcel volumes were 3,611 million and domestic parcel revenues were £9,088 million in 2024–25. [2] This demand is reinforced by online retail: in London-focused analysis (useful as a bellwether for dense UK cities), 26% of retail sales were online in 2022. [3]
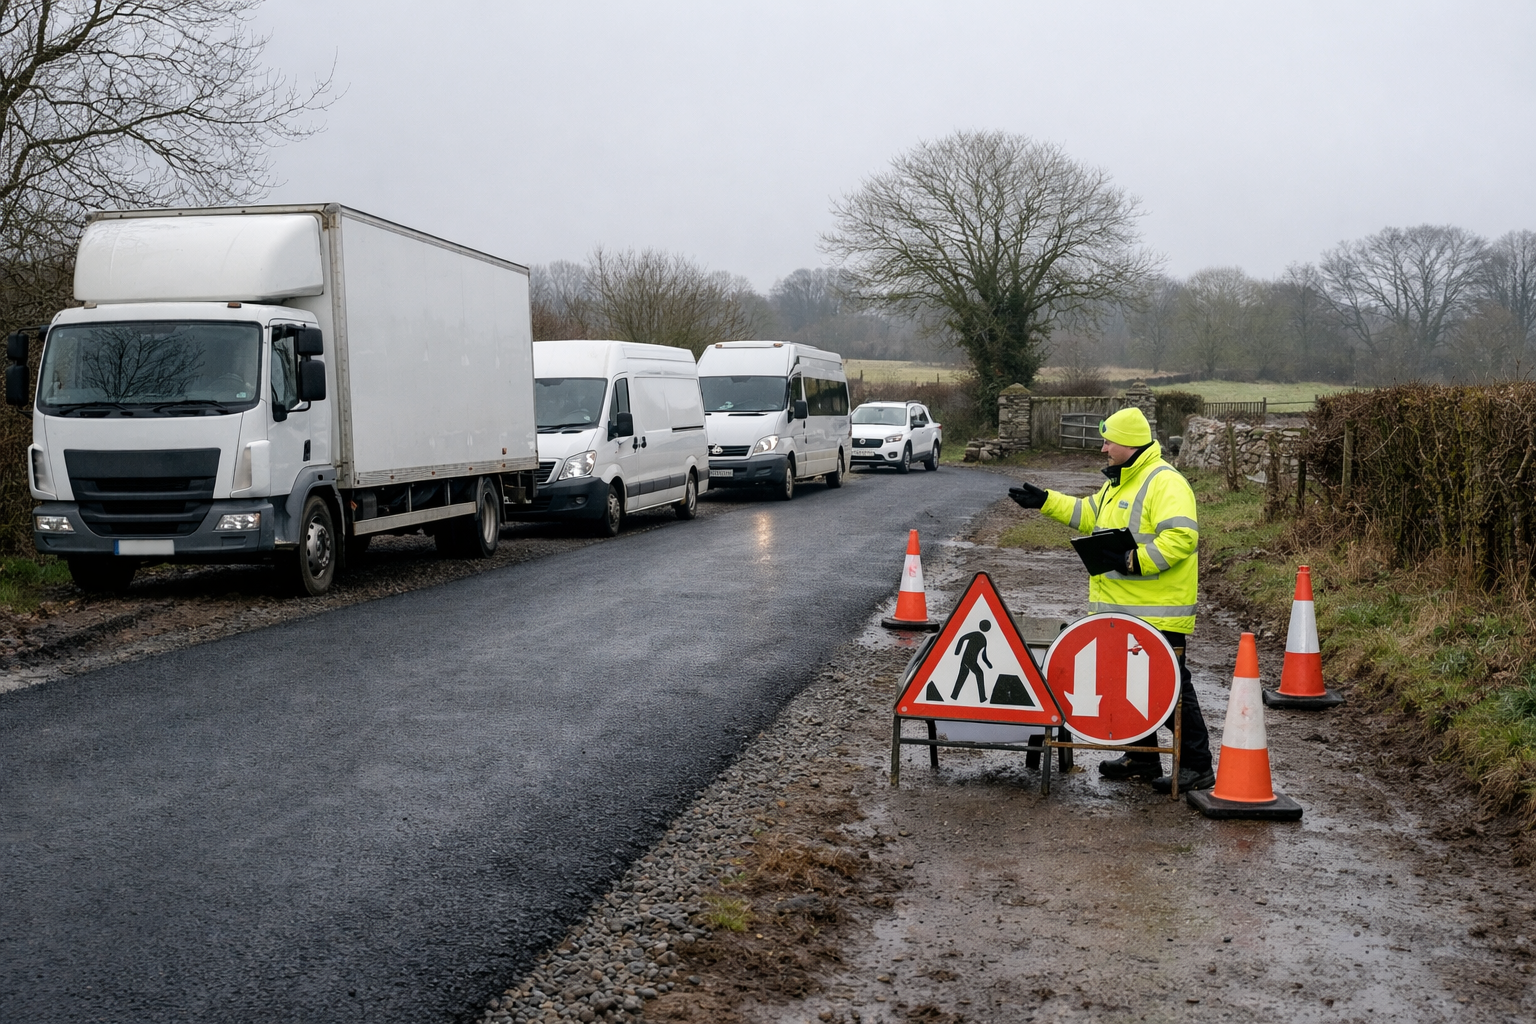
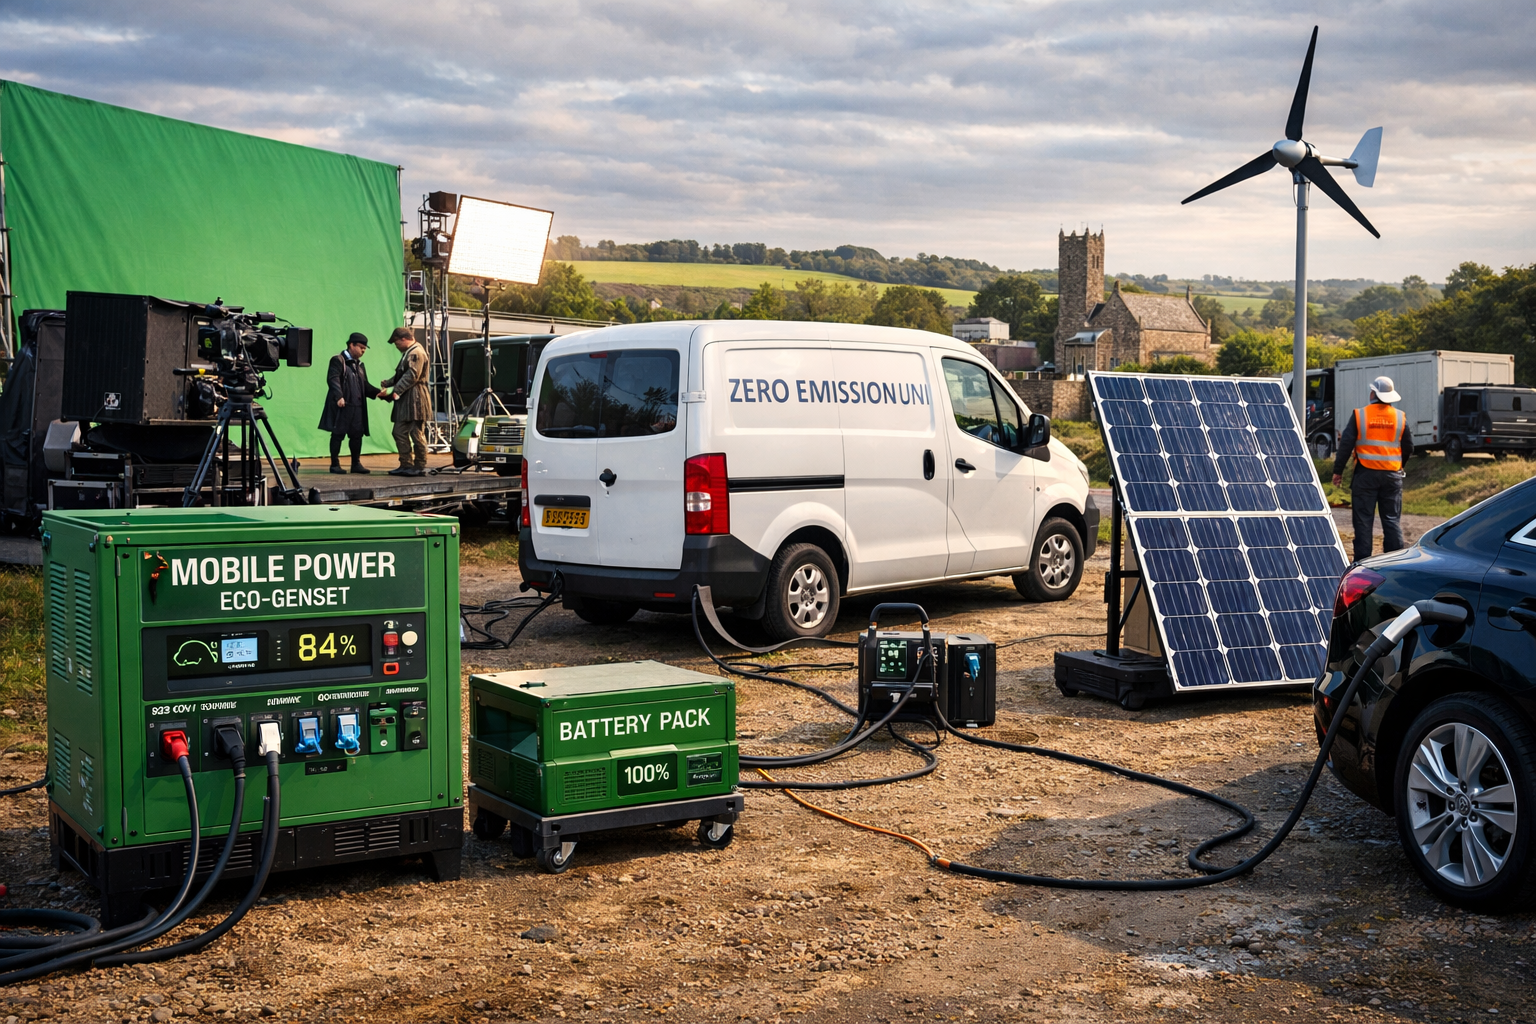
At the same time, the operating environment is tightening. Van traffic in Great Britain reached 58.5 billion vehicle miles in 2024 and was 9.5% higher than 2019, increasing pressure on kerbside space and journey-time reliability. [4] Policy levers such as Clean Air Zones (CAZ) and net zero targets are pushing operators towards lower-emission assets, while the Zero Emission Vehicle mandate is reshaping new-vehicle supply, requiring rising proportions of new van sales to be zero emission through to 2035. [5]
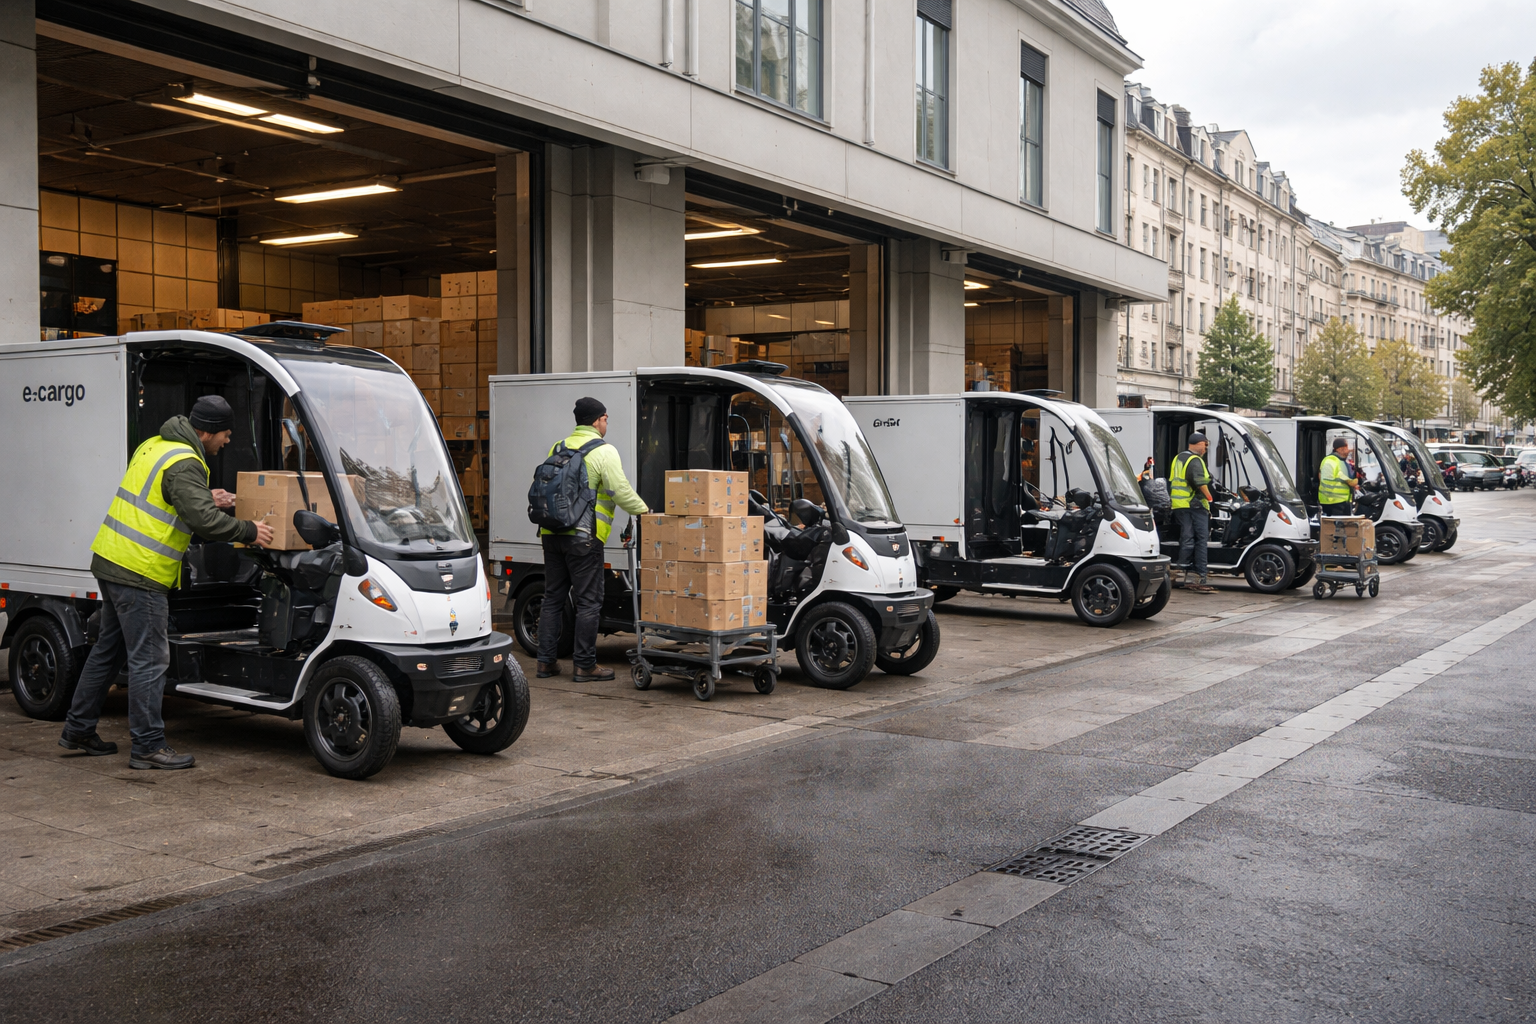
Against that backdrop, cargo bikes and e‑mopeds are increasingly practical tools for short-radius, high-drop-density work. In central London, Transport for London’s (TfL) active travel counts recorded cargo bike daily counts rising from 4,915 (2022) to 6,998 (2023), a 42% increase. [6] TfL’s demand modelling suggests cargo bikes could replace up to 17% of van kilometres in central London by 2030, with London-wide carbon savings of 10,000–30,000 tonnes of CO₂ per year by 2030 under its scenarios. [7]
For finance decision-makers, the core question is no longer whether these assets “work”, but where they work, how they integrate with hubs and routing, and how to fund mixed fleets. Cargo bikes typically cost £5,000–£16,000 depending on configuration, while road-legal e‑mopeds can sit around the low-thousands for purchase, and small diesel vans typically start in the mid‑£20k ex‑VAT range (with electric small vans materially higher, albeit supported by grants). [8]
What “last mile delivery” means in UK transport terms
Last mile delivery is best understood as a service layer rather than a single vehicle type. It includes:
- Home delivery (B2C parcels, groceries, meal kits)
- Business deliveries (B2B stock top-ups, parts, maintenance consumables)
- Returns and reverse logistics
- “Out-of-home” models where the endpoint is a locker, parcel shop, collection counter, or a neighbour/concierge, not the recipient’s front door [9]
In UK parcels data, out-of-home delivery is now material. In 2024–25 it represented 12% of domestic parcel volumes (up from 11% the year before), signalling that the “last mile” endpoint is diversifying as networks seek to cut costs and increase first-time delivery success. [10]
Operationally, the last mile has four features that are unusually acute in UK towns and cities:
- High stop density and short legs: productivity comes from drop density, not cruising speed.
- Kerbside scarcity: loading/unloading time and legality (parking, idling, access restrictions) often dominate route performance.
- Service-time constraints: timed deliveries, consumer tracking expectations, and retailer SLAs.
- Externalities that now price in: emissions charging, restrictions, and reputational pressure via local air quality and net zero commitments. [11]
This is why the “last mile” is increasingly discussed in the same breath as urban mobility. It competes with buses, cyclists, pedestrians, construction activity, and private vehicles for limited street space, while being a visible source of congestion in high-footfall areas. [12]
Why it matters for UK logistics and urban mobility
The UK last mile is powered by two big demand curves: parcels growth (driven by online retail) and urban van traffic.
In regulated UK postal/parcels monitoring, total parcel volumes moved from 3,628 million (2022–23) to 3,936 million (2023–24) and 4,214 million (2024–25), with domestic volumes reaching 3,611 million in 2024–25. [13] Revenues have not grown in line with volumes: total parcel revenues fell over the period from £17,275 million (2020–21) to £13,185 million (2024–25) (in 2024–25 prices), indicating sustained price/competition pressure and a strong incentive to reduce unit delivery costs. [14]
On the road network, Department for Transport headline road traffic estimates show van traffic (LCVs) rising to 58.5 billion vehicle miles in 2024, above pre‑pandemic levels (9.5% higher than 2019). [4] That matters because last mile delivery performance is sensitive to marginal congestion; small increases in delay multiply across multi-stop rounds.
Environmental policy adds another layer. UK emissions reporting consistently shows transport as a dominant emissions source in national totals. Provisional government statistics for 2024 reported domestic transport as 30% of UK emissions, reinforcing why decarbonising delivery activity remains a policy priority. [15]
Air quality is the nearer-term urban trigger. Evidence reviews have highlighted that vans are a disproportionate contributor to urban exhaust pollution in many settings, which is one reason local and national policy has leaned into clean air charging and access management. [16]
The practical outcome is that last-mile fleets are being re-optimised around three levers:
- Trip substitution (replacing some van kilometres with lighter vehicles such as cargo bikes and small electric two-wheelers)
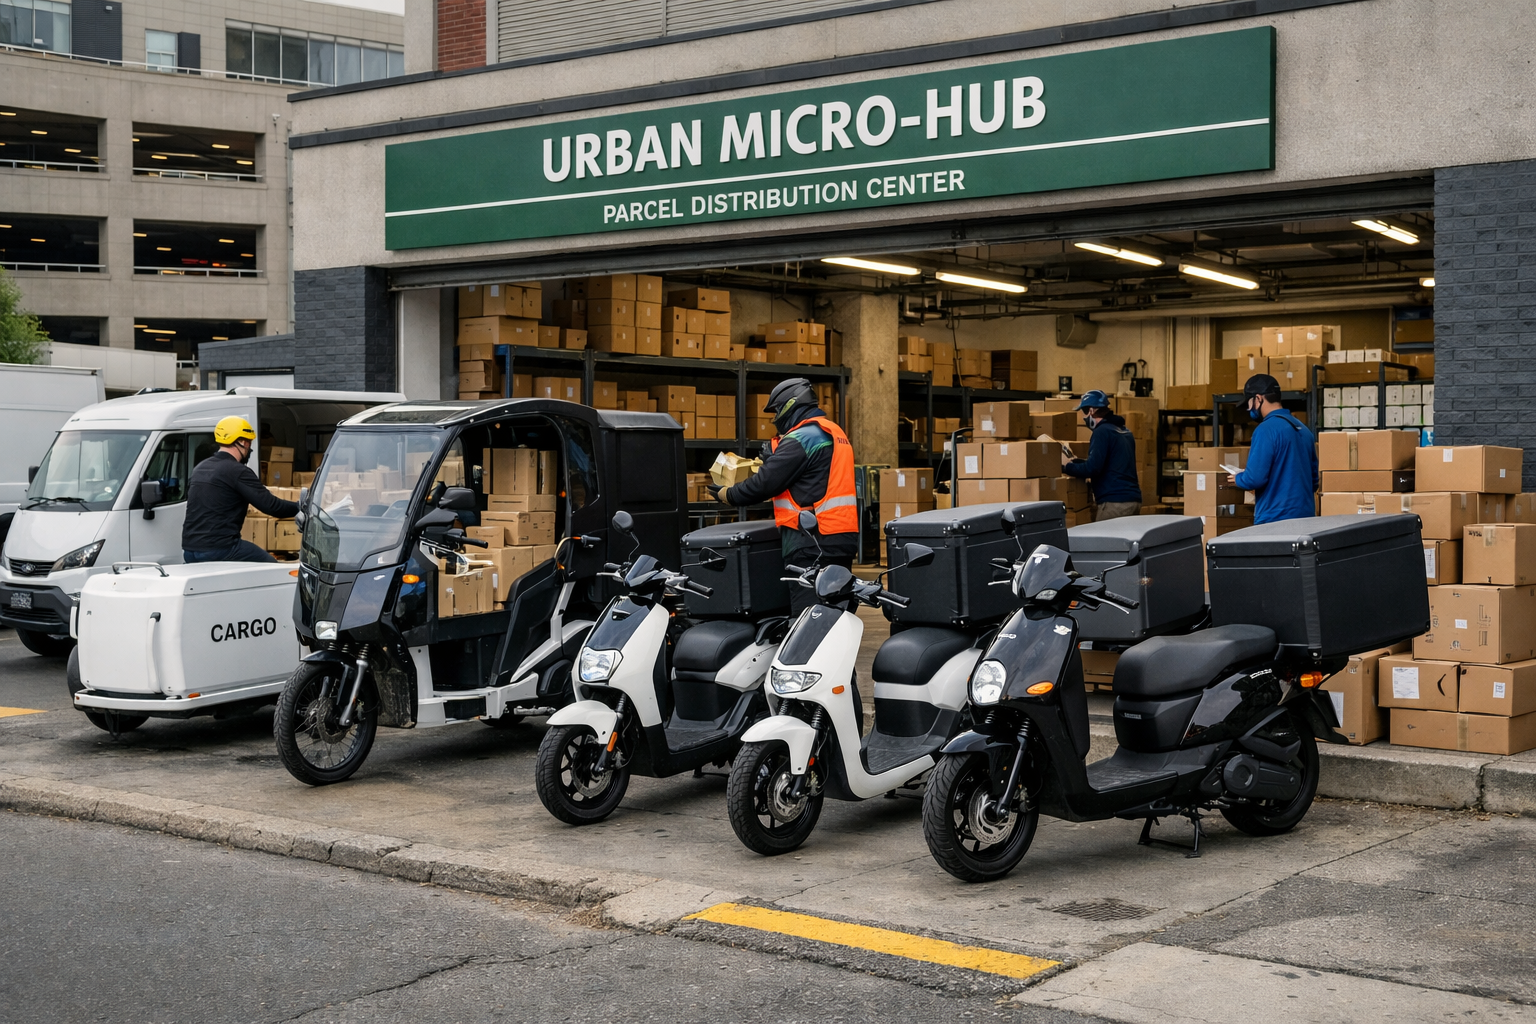
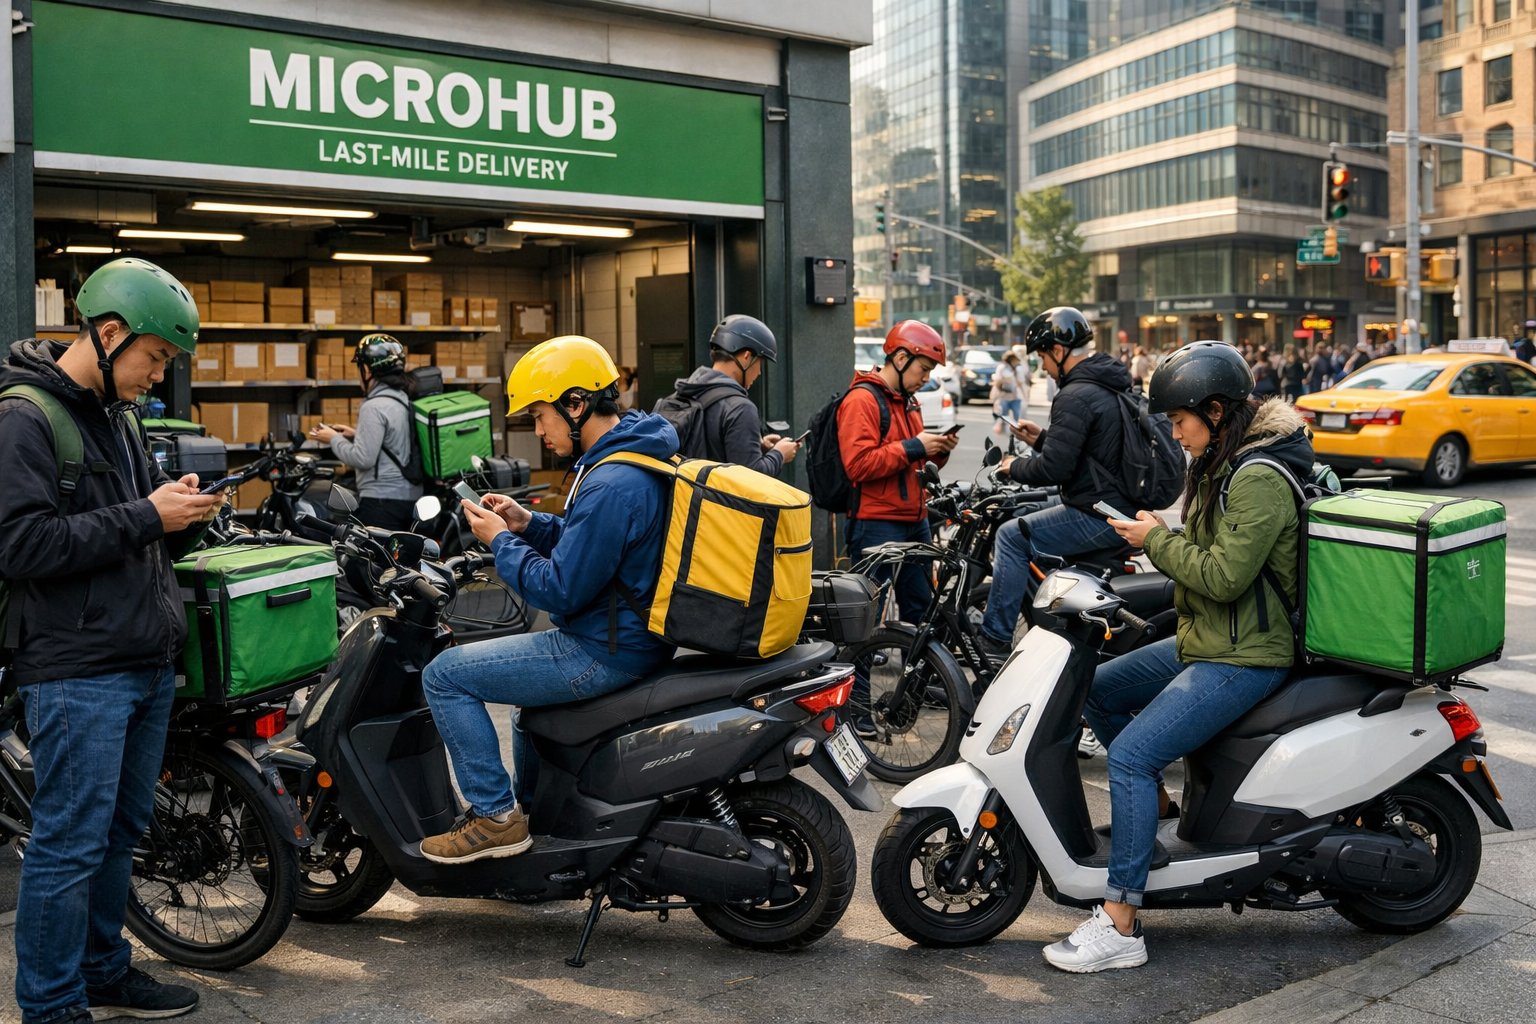
- Consolidation and micro-hubs (shortening the van leg and densifying delivery rounds for smaller assets)
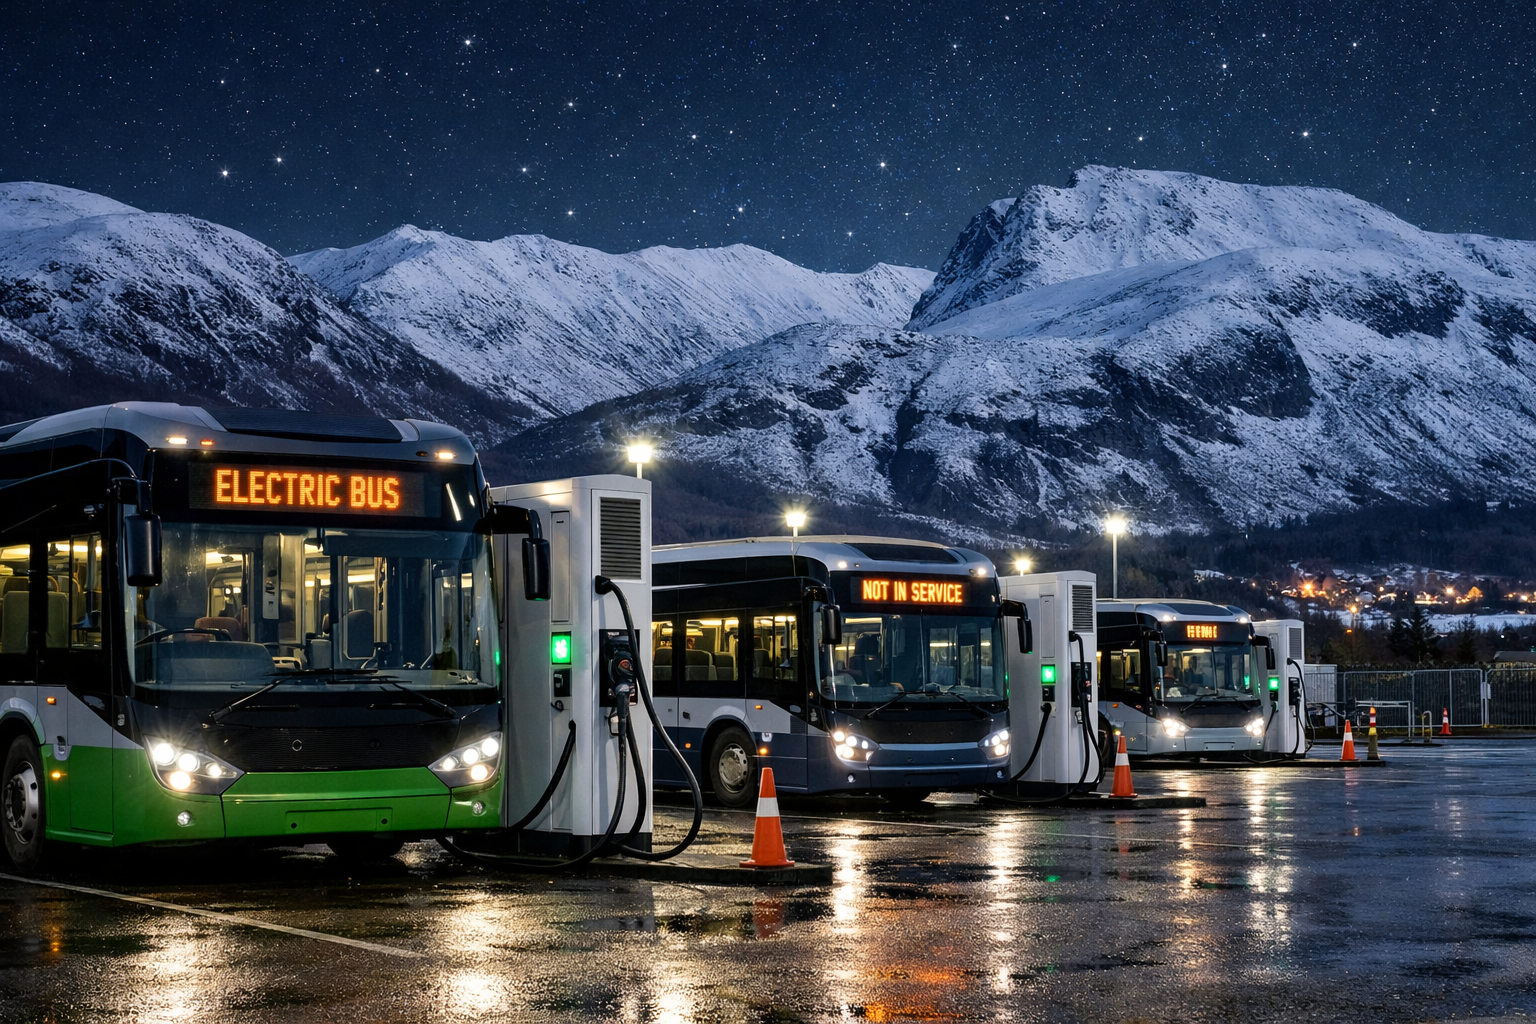
- Electrification (electric vans and two-wheelers where duty cycle allows, supported by charging infrastructure)
[17]
Market size, growth trends, regulation, and stakeholders
Current market size and growth signals
A practical UK “market size” proxy for last-mile activity is the parcels market. In 2024–25, monitored parcel volumes and revenues were: total parcels 4.214 billion items and revenues £13.185bn (2024–25 prices), with domestic parcels 3.611 billion and £9.088bn. [18]
For trend context, the five-year series from the same dataset shows volumes recovering after a decline, while revenues remain lower than the pandemic peak, emphasising the commercial logic for alternative assets that reduce time-at-kerb and per-drop cost. [18]
Regulatory drivers shaping fleet choices
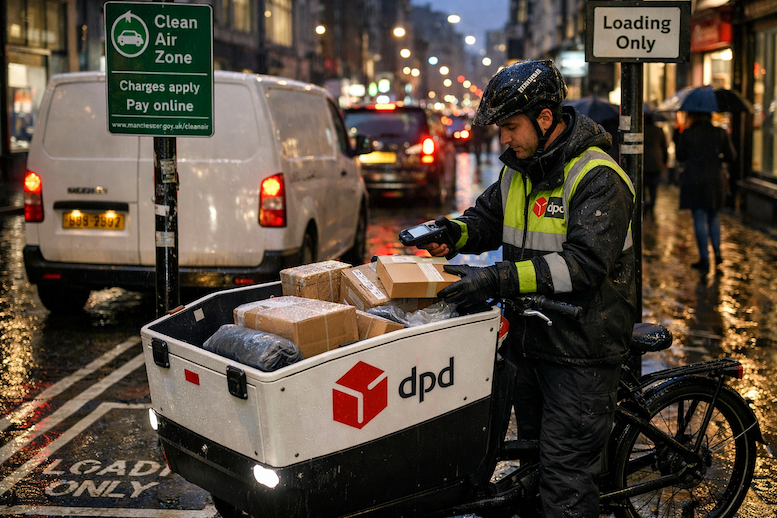
Clean Air Zones are a direct driver of fleet refresh and route planning in English cities with charging schemes. Government guidance confirms charging CAZ operate 24/7 and charges run midnight to midnight, which matters for vehicles that re-enter a zone across multiple days. [19] The national framework sets principles and vehicle classes for CAZ design. [20]
Net zero is the strategic backdrop. UK law set a binding 2050 target requiring the net UK carbon account to be at least 100% lower than the 1990 baseline, widely referred to as the net zero target. [21]
For road vehicles, the Zero Emission Vehicle mandate is a supply-side mechanism. Government announcements and consultation material describe a rising requirement for manufacturers, including that 70% of new vans sold in Great Britain should be zero emission by 2030, rising to 100% by 2035, with interim annual targets starting in 2024. [22]
Grants influence purchasing economics. For example, the UK plug‑in van grant provides discounts for eligible electric vans, with the maximum discount for some small electric vans set at £2,500, subject to eligibility conditions including a minimum zero-emission range. [23] Workplace charging support can also shift infrastructure payback, with the Workplace Charging Scheme covering up to 75% of purchase and installation costs, capped at £350 per socket, up to 40 sockets across sites per applicant. [24]
Key stakeholders in UK last mile delivery
The last-mile ecosystem is a multi-party operating model:
Retailers and marketplaces set delivery promises and often determine whether fulfilment is centralised or store-based, which in turn dictates whether micro-hubs and small vehicles can be used. [3]
Courier and logistics operators (including parcel networks and on-demand platforms) decide fleet mix, routing tech, and labour model, and are the primary buyers/lessees of vans, e‑mopeds, and cargo bikes.
[25]
Local authorities shape operating constraints through kerbside policy, CAZ design, parking rules, and support for consolidation sites, with sector bodies explicitly arguing that councils have a defining role in sustainable last-mile design due to their place-based knowledge.
[26]
Fleet funders and asset finance intermediaries determine the availability of capital for mixed-fleet transitions, including vehicle funding and charging infrastructure investment, which is increasingly part of one integrated capex conversation.
[27]
| Attribute | Cargo bike (electric assist) | E‑moped (electric, 28mph-class) | Small van (diesel baseline, UK avg) |
|---|---|---|---|
| Indicative purchase cost (ex VAT) | £5,000–£16,000 | ~£2,000–£2,500 | ~£23,500–£24,340 (small vans; examples) |
| Typical usable payload | Up to ~200kg payload / ~275kg gross system weight (varies by model) | Primarily rider + small parcel payload (top box), varies by model | Payload capacity class shown at ~1.01 tonnes (average van category) |
| Typical “last mile” working range | 40–100 miles (example with two 500Wh batteries) | ~36–50 miles (example models/reviews) | Duty-cycle dependent; generally far higher than two-wheel EVs |
| Operational emissions (CO₂e/km, illustrative using UK grid factor for electricity) | ~1.3–3.2 g/km (derived) | ~5.3–6.5 g/km (derived) | 255.8 g/km direct (diesel average van factor) |
| Tailpipe emissions | 0 g/km | 0 g/km | Non-zero |
| Urban access/kerbside | Can use cycle lanes; can park close to drop points | Strong in stop-start urban use; easier parking than vans | Most constrained by kerbside, congestion, and charging zones |
| Typical use-cases | Multi-drop parcels, local store replenishment, servicing tools/parts, waste sacks | Food delivery, on-demand small parcels, spares, longer legs than bikes | Bulkier parcels, multi-route coverage, higher volume rounds, heavy payloads |
| Typical use-cases | Multi-drop parcels, local store replenishment, servicing tools/parts, waste sacks | Food delivery, on-demand small parcels, spares, longer legs than bikes | Bulkier parcels, multi-route coverage, higher volume rounds, heavy payloads |
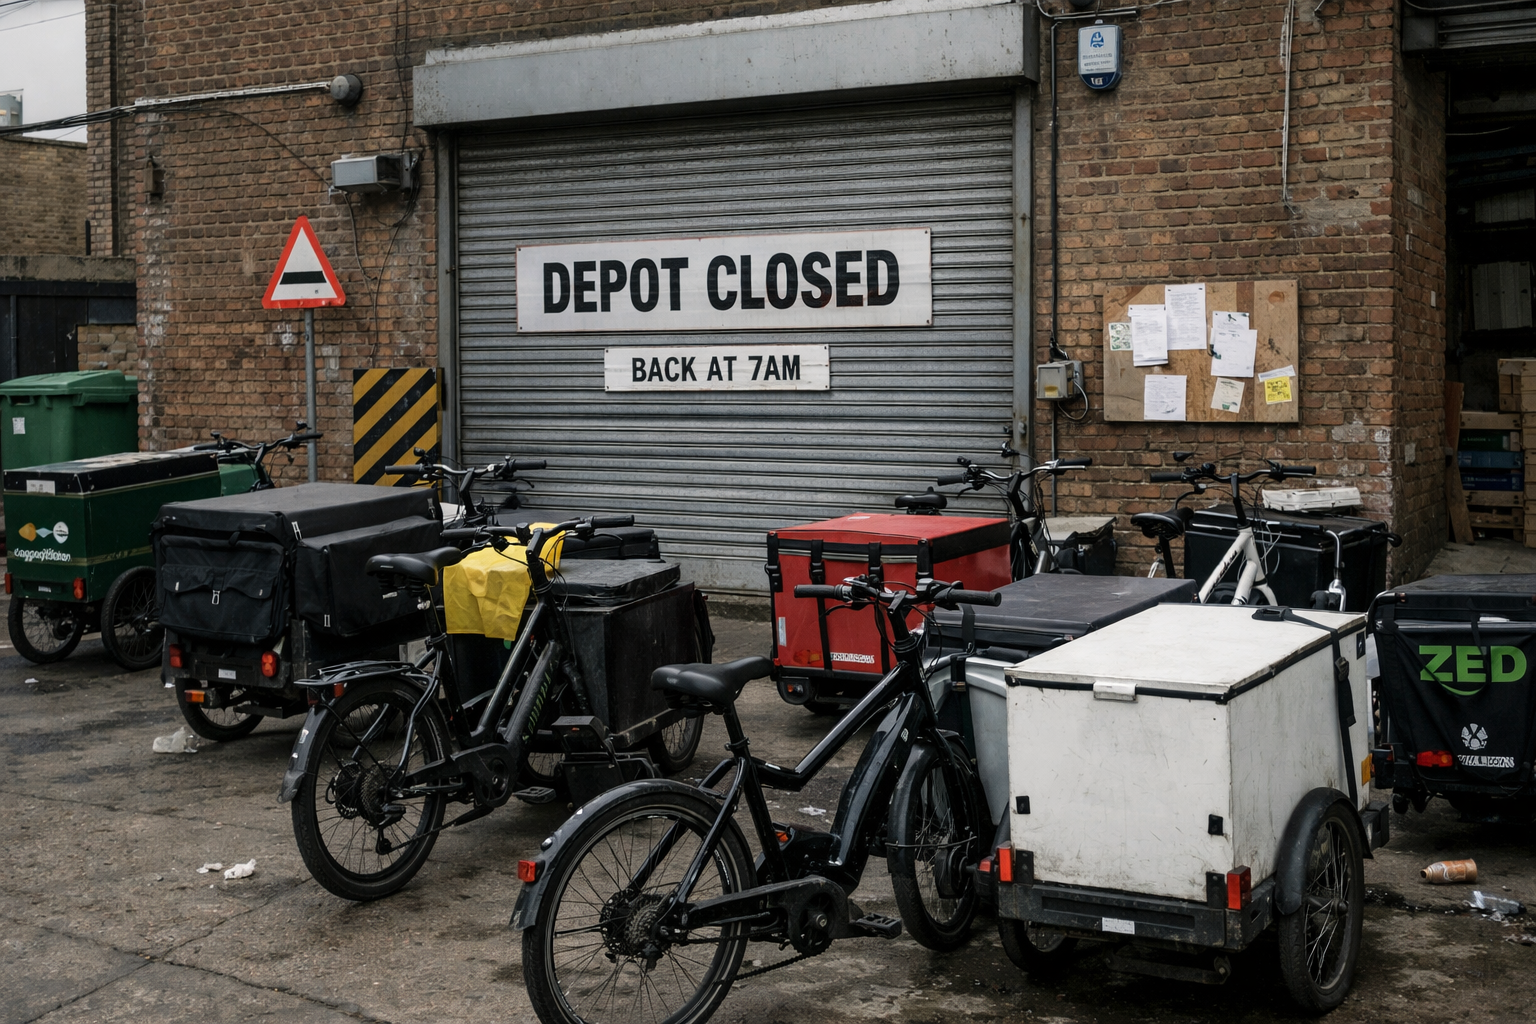
Asset focus: cargo bikes and e‑mopeds in UK last mile fleets
Cargo bikes in commercial last mile operations
In UK terms, most delivery cargo bikes used for parcels and servicing are electrically assisted pedal cycles (EAPCs), which have specific legal characteristics (for example, pedal assistance, a maximum continuous rated power of 250W, and an assistance cut-off at 15.5mph). [28] This matters because it affects licensing, training, infrastructure compatibility (cycle lanes), and operational speed assumptions.
Evidence from TfL’s freight work shows measurable growth and operational detail in London:
- Central London cargo bike counts rose from 4,915 (2022) to 6,998 (2023) in TfL’s active travel counts, a 42% increase. [6]
- TfL’s modelling suggests that, under enabling measures, cargo bikes could replace up to 17% of van kilometres in central London by 2030, with London-wide displacement in the 1–4% range by 2030 depending on area and scenario. [7]
Commercial specs vary by configuration (two-wheel “Long John” styles vs tricycles vs quadricycles). TfL’s operator guidance includes indicative real-world specs from case studies, such as:
- Recommended gross weight capacity around 275kg (bike + rider + load) on certain commercial e‑cargo configurations
- Typical e‑cargo ranges stated as 40–100 miles using two 500Wh batteries (effectively ~1.0kWh on-bike), with 15.5mph assistance cut-off consistent with EAPC rules [29]
Cost positioning is one reason fleets adopt them. TfL’s 2024 guidance states cargo bikes can cost £5,000–£16,000 depending on type and configuration, while also noting potential savings from avoided congestion, emissions or parking charges and from closer parking to delivery points. [30]
Operational use-cases that repeatedly show up in UK practice include:
- Parcel drops within a small hub radius (TfL case studies cite typical coverage areas “about a five‑kilometre radius” for some cargo-bike-first models)
- Servicing and maintenance tasks (tools, small parts, call-outs) replacing a portion of a light van’s urban work
- Waste and recycling sacks collection (for example, tricycle payloads cited at 200kg in a London case study) [31]
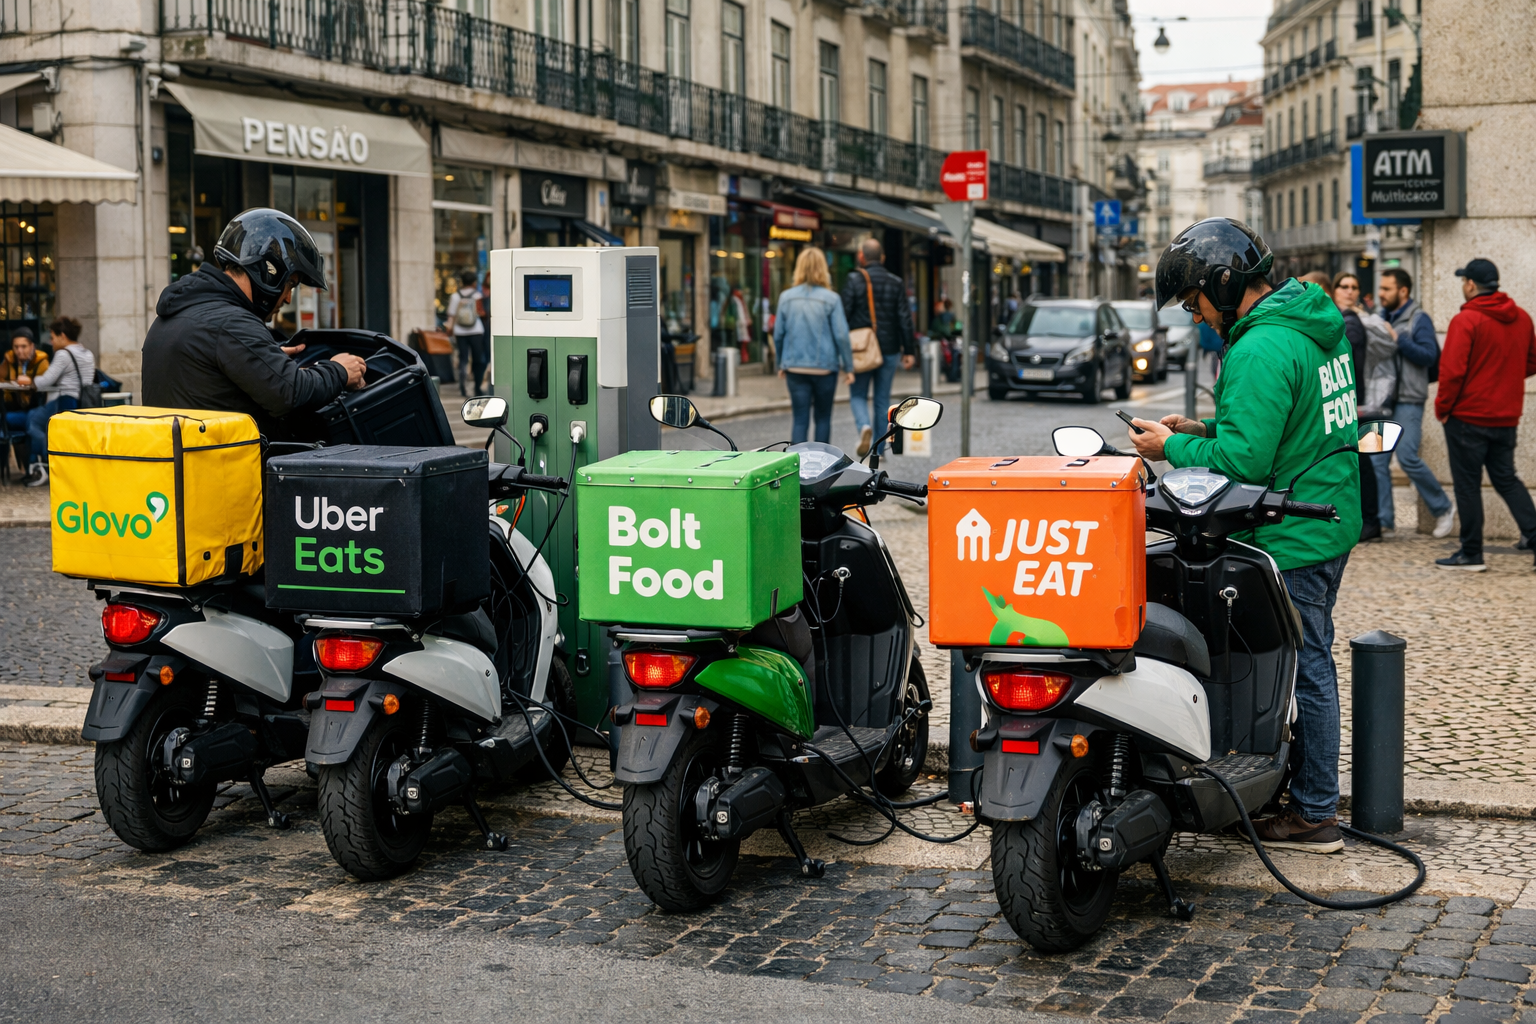
E‑mopeds as a bridging asset between bikes and vans
For dense urban delivery, “e‑moped” usually means an electric two-wheeler in the moped class, typically limited to around 45km/h top speed in the relevant category, with registration and licensing rules applying. [32] This sits in a different operational niche to cargo bikes: faster on primary roads, less reliant on cycle infrastructure, and better suited to longer legs or lower stop density, while still being small enough for constrained kerbside environments.
UK market signals for electric two-wheelers can be seen in vehicle licensing statistics. In July–September 2025, there were 959 zero emission motorcycles registered for the first time, representing 3.3% of new motorcycle registrations in that quarter (with the prior year share shown at 3.4%). [33]
Indicative delivery-relevant specs from commonly sold UK models and independent reviews show the typical performance envelope:
- Battery capacities around 1.8–2.0kWh and charge times around 6–7 hours on 3‑pin charging
- Real-world or tested ranges in the mid‑30s to ~50 miles for 28mph-class machines (range will vary with rider weight, speed mode and ambient conditions)
- Purchase prices in the low-thousands for 50cc‑equivalent electric scooters in UK retail channels [34]
Where the duty cycle works, e‑mopeds can reduce fleet cost exposure to CAZ-style charging and decouple some delivery work from van parking constraints. The trade-off is payload volume (often a top box + footwell + small rack) and weather/seasonality constraints for riders, which means they tend to work best when integrated into a hub-and-spoke model rather than treated as a direct substitute for every van route. [35]
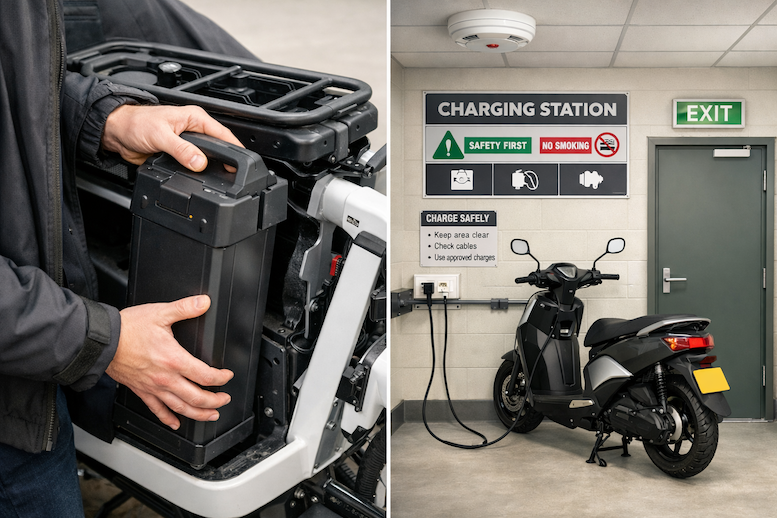
Battery safety and storage are non-trivial for both cargo bikes and e‑mopeds, especially where batteries are removed and charged indoors or in depot environments. The London Fire Brigade’s #ChargeSafe guidance is explicit about safe charging behaviours and the risk profile of lithium-ion batteries, which is relevant for operator policies and insurance discussions. [36]
| Period | ZEV share of new LGV registrations | ZEV share of new motorcycle registrations | Notes |
|---|---|---|---|
| 2022 Q3 | 5.0% | 5.1% | prior-year shares shown in DfT Q3 2023 bulletin |
| 2023 Q3 | 6.2% | 3.3% | counts shown: LGVs 5,585; motorcycles 1,093 |
| 2024 Q3 | 5.7% | 3.4% | prior-year shares shown in DfT Q3 2025 bulletin |
| 2025 Q3 | 9.8% | 3.3% | counts shown: LGVs 9,495; motorcycles 959 |
Emissions and “cost of ownership” comparison, grounded in UK reporting factors
To compare operational emissions on a consistent UK reporting basis, this report uses:
- UK government greenhouse gas conversion factors methodology for diesel vans (direct gCO₂e/km) [37]
- UK electricity grid emissions factors (kgCO₂e/kWh for electricity consumed, including grid losses) [38]
- Energy-use estimates derived from cited battery capacities and measured/claimed ranges for exemplar cargo bikes and e‑mopeds [39]
The result is stark: operational CO₂e per kilometre for e‑cargo bikes and e‑mopeds (using grid electricity) is typically orders of magnitude below a diesel van’s direct tailpipe emissions, even before considering congestion and local air quality impacts. [40]
For finance and operations teams, “cost of ownership” in last mile delivery is rarely just energy and servicing. It is normally driven by:
- Utilisation and drop density (parcels/hour)
- Labour model and training
- Infrastructure (micro-hubs, secure storage, charging)
- Insurance and risk (theft, rider safety, battery fire policy)
- Regulatory costs (CAZ charges, access restrictions, parking penalties)
- Residual value and asset redeploy-ability across contracts or cities [41]
These are precisely the areas where finance structure can be made to match operational reality. On Avro’s own site, the positioning is explicitly around funding single units or fleets, refinancing, and bundling related assets such as EV charging infrastructure alongside vehicles. [27]
Publishing pack: tables, charts, datasets, internal links, and creatives
Notes on sources used in the table: cargo bike cost range and exemplar range/payload values come from TfL cargo bike operator guidance. [42] E‑moped prices and example ranges/capacities come from independent UK reviews and manufacturer specifications for 50cc‑equivalent electric scooters. [34] Diesel van emissions (gCO₂e/km) and payload class context come from the UK government greenhouse gas conversion factors methodology paper. [43] Small van starting prices are illustrated using UK manufacturer/retailer starting prices for common compact van models. [44]
You might also like